

There are many reasons for initiating an Agile transformation of a marketing organization. Some departments do so driven by the desire to enhance their ability to manage changing priorities. Others aim to improve their productivity or accelerate the delivery of their marketing programs.
Whatever the reason to get started with Agile may be, it's crucial to be able to measure our progress toward achieving that goal.
How do we do so?
By incorporating some fundamental Agile metrics and keeping a close eye on them.
They help us measure key performance indicators of the marketing process and give us solid data for improving it further. What are these Agile metrics? Why do they matter? How to make the most of them?
Let's find out.
What are Agile Metrics?
As the name suggests, these are metrics that enable us to understand the agility of our process and improve its performance. The main difference between Agile metrics and other process metrics is that Agile metrics are targeted toward outcomes instead of simply measuring outputs.
They help us understand the flow of value that passes through our marketing process, discover flaws, and focus on delivering greater value to our customers.
They are an essential factor for achieving marketing agility (or business agility for that matter) and sustainably maintaining high performance levels over time. There are method-specific metrics that are applicable with methods, such as Kanban or Scrum, and universal Agile metrics. The latter are applicable in any context and have great value for marketers, but it's also useful to be familiar with the framework-specific metrics too.
We'll get into both below.
Why Do We Need Agile Metrics?
I’m a big fan of starting with the end in mind.
Why are we here?
Why Agile marketing?
What are we trying to accomplish by going Agile?
Maybe traditional waterfall planning no longer works for the team. According to McKinsey, 58% of marketing initiatives still take more than 6 months to make it to market, with the average at just over 8 months.
That’s a long time to wait to deliver value to our customers.
Maybe the CMO read some thought leadership article about Agile marketing and asked us to check it out.
Or maybe we’ve been working alongside a development team and grew envious of their productivity and effectiveness using Agile.
When it comes to measuring the success of an Agile marketing program, goals tend to fall into three main groups:
- Demonstrate the return on investment (ROI) in Agile marketing (and there is a significant investment involved in time, people, and money...more on this in a separate post).
- Make the business case and get buy-in from our leadership to pilot or expand an ongoing Agile marketing program.
- Improve Agile marketing to better serve internal or external customers.
All are great goals and a good reason to start measuring our Agile marketing program, and many of the metrics we’re going to discuss will help with all three.
Agile Metrics that Matter the Most
According to Eric Ries’ Lean Startup, the only metrics we should invest in are those that help us make decisions. In Lean Forecasting Troy Magennis goes even further to suggest that, “If a metric does not offer predictive power, then capturing that metric is waste.”
When it comes to measuring goals, for many years I’ve been using a goal-setting framework known as OKRs, which stands for Objectives and Key Results. This framework stipulates that for every objective we set up, we then list three key measurable results.
If our objective is to successfully implement Agile marketing, below are three core metrics we should measure (or we at AgileSherpas can help you measure) before, during, and after a successful Agile marketing implementation.
Efficiency
Efficiency is the single most important metric for measuring the success of an Agile marketing team. The efficiency of our workflow is defined by the ratio between the time our tasks spend waiting in queues and the time they are being actively worked on.
Looking at the average efficiency value of a specific type of task will give us process efficiency.
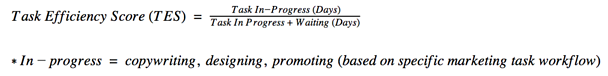
While taking the average for all tasks would reveal the marketing team’s general efficiency score.

Cycle Time
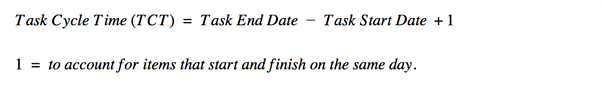
Cycle Time reflects a customer-centered view on the time our marketing team takes to deliver results. Cycle Time ultimately answers the question, “When will it be done?”
Looking at the cycle time for the same type of tasks gives us an idea of how quickly the team deals with that kind of task.
If we notice a serious increase of cycle time across the workflow, that means we have a bottleneck or other internal issues that need attention. We might also want to limit the Work In Progress items in order to improve your cycle time.
In the Agile marketing teams that we work with, the cycle time of marketing tasks post-Agile tends to be dramatically lower than the time it took to accomplish the same kind of tasks pre-Agile marketing.
Before you keep reading, The Ropes gives you 100+ hours of FREE Agile marketing courses, exclusive resources, and certification & coaching giveaways — completely free.

Throughput
Throughput reflects the number of tasks that get completed within a fixed amount of time. It’s basically the sum of all parts.
When our Task Efficiency Score is up and the Cycle Time is down, our Throughput is higher!
Before proceeding to learn why these metrics are vital, why don't you take a second to get our OKR Cheatsheet?
Why are Those Three Agile Marketing Metrics so Important?
In our experience training thousands of marketers on Agile marketing, these three core metrics: Efficiency, Cycle time, and Throughput, take very little time to collect and offer the biggest bang for our buck.
They deliver precious insights into the overall health, performance, and predictability of our Agile marketing practice.
We also find those metrics are:
Easy to capture and start measuring: Any Agile tool should track these metrics. Even if you don’t have an Agile tool, these metrics are very easy to manually track using a simple spreadsheet.
Cost-effective: There’s no point in tracking a metric if it is going to bankrupt our marketing budget or make everything else go slower. Herein lies yet another advantage of tracking these particular metrics for Agile marketing: these metrics are very inexpensive to gather.
Actionable: These metrics will suggest specific interventions that we can make to get back on track. In other words, these metrics are actionable! Items taking too long? Not getting enough done? These metrics will provide some of the magic levers we can pull to make things better.
Easy for our stakeholders to understand: What we often find implementing Agile marketing is that traditional Agile metrics are not well understood outside Agile software teams. Good luck trying to explain to the CFO what a story point means, or getting marketers excited about huddling around a burndown chart.
However, our stakeholders likely understand the concept of elapsed time and the total number of marketing tasks to be delivered in a sprint.
There are most certainly other metrics that we will want to track in our own environment, but these three central pillars represent the metrics common to all Agile marketing implementations. Still, it wouldn’t be fair if we stop here without at least going over some important method-specific Agile metrics beneficial to marketers applying Kanban or Scrum.
Key Kanban Metrics

The continuous nature of a Kanban process requires marketers to add a few flow-related Agile metrics to their measurement stack. Each of them helps us get a more granular view of the marketing workflow and improve the values of the three core metrics we’ve presented so far.
Work In Progress (WIP)
Work in Progress (WIP) indicates the number of tasks, initiatives, or projects we are working on simultaneously. It's one of the most important Agile metrics for marketers who apply Kanban.
WIP is a metric that shows us how much work has been started. WIP directly affects both our throughput and cycle time. The logic is simple: if we have a high WIP level, the team experiences more context switching. This results in higher cycle times and lower throughput.
We can affect this Agile metric by rigorously limiting work in progress. This means placing a firm ceiling on the number of work items we can tackle at any given moment. If we're at that limit, we have to finish something before we start a new task.
Blocked Time
Blocked time is a metric that showcases the time a work item spends waiting on something outside of our control. Measuring it is invaluable for optimizing the agility and performance of our marketing process further.
By tracking the average blocked time of items that pass through our process, we can start paying more attention to steps that require external involvement. This gives us the opportunity to communicate ways to collaborate better with stakeholders and freelancers that directly affect our ability to deliver value.
Measuring blocked time is relatively easy. If using a physical Kanban board, we can just mark with red dots the days each card spends blocked. Digital platforms, on the other hand, often come equipped with analytics that track this metric automatically.
The Most Important Scrum Metric
Even though marketers traditionally adopt a hybrid approach to Agile, Scrum remains a treasured framework for applying it. The 7th Annual State of Agile Marketing Report documented that in 2024, 25% of the Agile marketing teams rely on it to manage their processes.
The iterative nature of the Scrum process requires planning and executing work in short sprints (usually two weeks long). To make this easier and achieve greater productivity and improved agility, Scrum teams need to measure velocity.
Velocity
Velocity is the average amount of work a Scrum team completes during a sprint; it's typically measured either in story points. This Agile metric is invaluable for estimating how much value a team can deliver within a sprint.
In addition, velocity helps the marketing owner in predicting how quickly the team can work through the backlog.
For example, if we keep track of velocity and know that our team delivers 30 story points per sprint on average, we can be pretty sure that it would take about 10 iterations to deliver 300 of them.
To make the most of this metric, we have to keep a close eye on it over time.
There are countless factors that influence the productivity of a team and we should stay vigilant for negative patterns, like plateaus or downwards trends, that drag down the team’s velocity and monitor how process changes affect it.
Ready to Start Measuring?
Agile metrics provide an enormous amount of information and an advantage for improving our marketing processes.
Their customer focus enables us to significantly improve our team's performance and deliver more value in less time. Each of the metrics we covered has enormous predictive power. With their help, we can plan our work more accurately and deliver more of the work we commit to.
There are three core Agile metrics that are invaluable to marketers (efficiency, cycle time, throughput). They are easy to capture and start measuring yet very actionable and simple for our stakeholders to understand.
Marketers that rely on Kanban or Scrum to apply Agile have several other important metrics that they can weave into their work process. For Kanban teams, it's beneficial to track work in progress and limit it, while keeping a close eye on how much time work items spend in a blocked state.
Those among us who practice Scrum work in short iterations called sprints. Therefore, it's important to understand how much work we are able to deliver on average per iteration. This helps us plan better and avoid overburden due to inaccurate sprint planning. Velocity gives us the opportunity to do just that.
In order to master data-driven decision-making, begin to quantify your process and how your team operates within it. Measuring cycle time, efficiency and throughput and then weaving in Kanban or Scrum metrics based on the Agile framework you’re applying is the best way to create a process dashboard that you and your team can rely on.
Before you move on, make sure to get your copy of the OKR Cheatsheet.

Topics discussed
Improve your Marketing Ops every week
Subscribe to our blog to get insights sent directly to your inbox.

