

This post is adapted from Andrea’s forthcoming book, Mastering Marketing Agility (Berrett Koehler, June 2020). She’s also producing a video series based on the book (new videos every Friday!), which you can subscribe to here.
Regardless of what stage an Agile marketing team is in, it needs to be aware of how it’s performing.
That means tracking two different levels of effectiveness: the process level and the marketing level.
Process level metrics tell us if Agile is doing its job; in other words, if the team is getting more done in less time.
Marketing level metrics, on the other hand, are the same things we’ve always measured (or at least should have always measured). They’re indicators of whether the marketing activities the Agile marketing team is executing are providing the expected outcomes.
While there are some framework-specific tracking options (velocity, for instance, only works with sprints), the two tracking options we’re zeroing in on here -- cycle time and throughput -- will work in any kind of Agile system. So whether you’re using Kanban, Scrum, or a hybrid, you’ll be able to monitor the performance of your Agile efforts.
An Agile marketing team can get away with only tracking one, but keeping an eye on both will provide better predictability for upcoming work.
Cycle Time: How Long Does Work Take?
First, cycle time is simply how long it takes a work item (something from the queue or backlog) to make it through the team’s entire workflow.
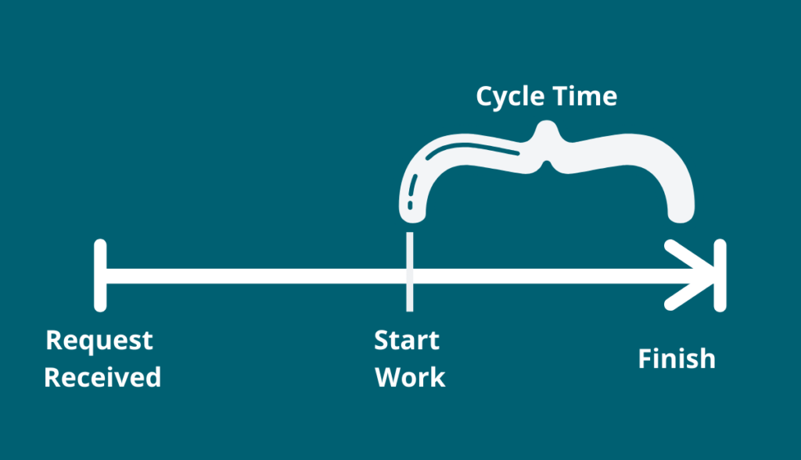
Said another way, cycle time is how much time passes between when the team starts on something and when they finish it. Most digital tools, both the Agile and traditional project management variety, should have this capability built in.
If an Agile team is using good old fashioned sticky notes, they just jot down the date when they started work on a card, and then add the date they finished it. Their cycle time is the difference in the dates.
So if my team started a card on Tuesday and finished it the following Friday, they had a cycle time of nine days (we don’t count weekends, because after all we’re supposed to be working at a sustainable pace).
| Date Started | Date Finished | Cycle Time |
| Monday morning | Wednesday afternoon | 3 days |
| Monday morning | Monday afternoon | 1 day |
| Monday morning | Next Friday morning | 10 days |
I like measuring cycle time because it smooths out some of the variability that comes with marketing work.
There are small work items, like writing a weekly blog post, that won’t ever take a long time (unless...you know...writer’s block). Then there are others, like drafting a new content strategy, that will take far longer.
Cycle time lets us embrace these different scales without getting caught up in making every item in the backlog the exact same size. After tracking cycle time for several weeks, we can reach a meaningful average that allows us to predict delivery time on work items before we start them.
Cycle Time for Specific Kinds of Work
While cycle time is useful for controlling for variations in marketing work, you can also track the cycle times of different types of work if that data is useful for your Agile marketing teams or your marketing leadership.
So we might track content creation work items in one table, but strategic planning work in another. Then we know about how long it takes us to complete a content-related work item compared to a strategic item with more specificity.
There are essentially an infinite number of things we could be measuring; we need to decide which ones will deliver the insight we need and only track those.
If different cycle times for different kinds of work might be useful, then by all means measure each one. If you can’t imagine what you’d do with that data, or if the team doesn’t work on a wide variety of items, just focus on their overall cycle time.
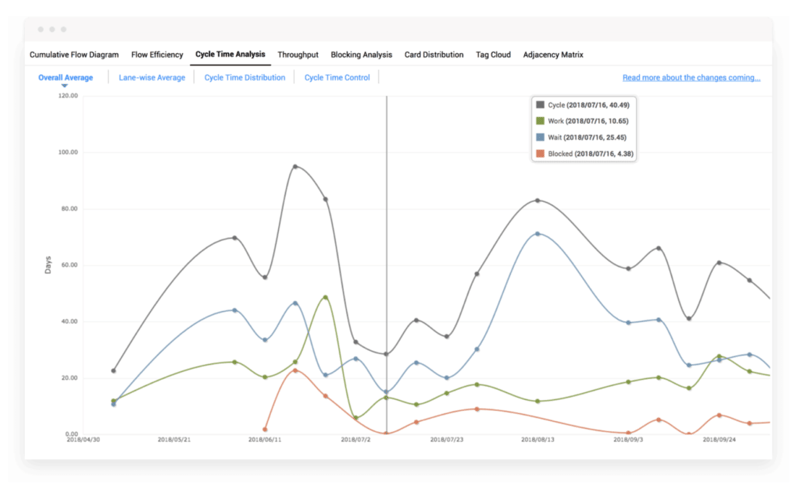
Image source: Digite
Throughput: How Much Work Are We Doing?
The second Agile metric we should all keep an eye on is throughput, or the number of items that an Agile marketing team completes in a set period of time (usually a week).
Like cycle time, throughput is work type agnostic.
It doesn’t care if the team finished five blog posts and two emails or three social media campaigns, three landing pages, and one ebook. In both cases their throughput is seven.
This data point is particularly powerful when it comes to predicting future delivery for items a bit lower in the team’s to-do list.
If we know the team finishes about eight work items per week, and a stakeholder comes to the team lead asking about an item that’s twenty-fourth in the queue, they can say the team is likely to complete that stakeholder’s item within three weeks. (Assuming, of course, that nothing happens to disrupt the order of the queue before then.)
To track throughput, the team simply needs to sit down every Friday afternoon and tally up all the items they completed that week.
On a physical board it’s a simple matter of counting what’s in the “Done” column. A digital tool will quickly sort all the items marked as complete in the past week.
As I said before, both cycle time and throughput apply to Kanban and Scrum, so you can have apples-to-apples data for different kinds of Agile marketing teams.
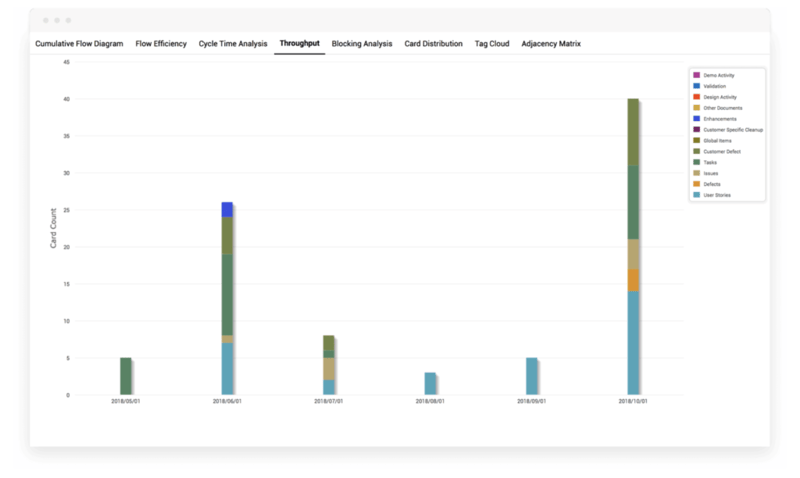
Image source: Digite
Before you keep reading, The Ropes gives you 100+ hours of FREE Agile marketing courses, exclusive resources, and certification & coaching giveaways — completely free.

Tracking Quality By Measuring Revisions
The final -- and optional -- process-level metric is rounds of revision. It’s most useful for teams that depend on external reviews with creative directors, legal, or other groups likely to provide multiple rounds of changes to the Agile team’s work.
This back and forth can eat up days, or even weeks, of time, so cutting down the number of handoffs in this cycle can be very valuable.
If your team has previously gotten stuck in endless rounds of review, you may want to keep track of how many times work items usually get revised. Fewer revisions indicate a more collaborative process, and they certainly indicate gains in process efficiency.
Measuring Marketing Outcomes
As we’re gaining a better understanding of how Agile marketing is helping teams get more done in less time, we should also keep an eye on whether they’re doing the right work at the right time.
I can’t give you a blueprint for this part, because every marketing department evaluates their success in a different way.
But whether it’s marketing qualified leads, email subscribers, or paid conversions, you want to know if you’re getting more of your primary success metrics following an Agile rollout.
Marketing-level metrics may vary among teams to give them an individualized way to evaluate what work they do to deliver value to their audience. But even if that’s the case, you should have a few overarching marketing metrics that all Agile marketing teams can roll up to.
A SaaS company, for instance, might have a yearly goal to reduce churn in its subscriber base. Each Agile team might have smaller micro-metrics they’re working on for their customers, but they should also be able to show how their overall efforts are contributing to the larger marketing objective of reducing churn.
Checking Pre- and Post-Agile Performance
As you can imagine, all of these metrics have the biggest impact when we have a before and after perspective.
It’s ideal for new Agile teams to take a look at them past performance before going Agile, and then to compare that to outcomes at both the process and marketing level following the transformation.
If the teams are new, i.e. they were created as part of the Agile rollout, try and get a departmental average for both process- and marketing-level data points. This is the best way of determining exactly how impactful your Agile efforts have been.
For instance, if we know most marketing projects currently take three months to deliver, and by following Agile practices a pilot team can deliver a similar project in just two weeks, we can point to a 6x improvement in delivery time (a common improvement for Agile teams).
For instance, during their pilot efforts, the Agile marketers at CA Technologies reduced their delivery time from two months to two weeks.
If a project-based team of eight people typically completes three items per week (and I’m being generous there I know), but an Agile team starts cranking out twenty four useful work items each week, we’ve achieved an 800% improvement in output.
Measure What Matters in Agile Marketing
Take the time before running your first Agile pilot to get a picture of your current performance. Check your process metrics as well as your marketing outcomes, and then compare them to how things go inside an Agile system.
Diligent measurement not only helps prove that the difficult work of change is worth, it helps teams quantify the impact they’re having on marketing’s overall performance. This can be particularly useful in areas like HLS marketing where leaders may not be as familiar with Agile or the value it brings.
Whether it’s cycle time, throughput, or both, keep your finger on the pulse of your metrics and outcomes to guide your long-term Agile efforts.
Don't stop here. The Ropes unlocks 100+ hours of free Agile marketing courses, resources, and more — one free registration away.
Topics discussed

Improve your Marketing Ops every week
Subscribe to our blog to get insights sent directly to your inbox.

%20in%20Agile%20Marketing%5B1920x1080%5DHeader.jpg?width=450&height=250&name=The%20Cost%20of%20Delay%20(CoD)%20in%20Agile%20Marketing%5B1920x1080%5DHeader.jpg)